Angular DevTools is a browser extension that provides debugging and profiling capabilities for Angular applications. Angular DevTools supports Angular v12 and later when compiled with the optimization configuration option disabled ({optimization:false}).
You can find Angular DevTools in the Chrome Web Store and in Firefox Addons.
After installing Angular DevTools, find the extension under the Angular tab in your browser DevTools.
When you open the extension, you’ll see two additional tabs:
Tabs
Details
Components
Lets you explore the components and directives in your application and preview or edit their state.
Profiler
Lets you profile your application and understand what the performance bottleneck is during change detection execution.
In the top-right corner of Angular DevTools you’ll find which version of Angular is running on the page as well as the latest commit hash for the extension.
Bug reports
Report issues and feature requests on GitHub.
To report an issue with the Profiler, export the Profiler recording by clicking the Save Profile button, and then attaching that export as a file in the issue.
Make sure that the Profiler recording does not contain any confidential information.
Debug your application
The Components tab lets you explore the structure of your application. You can visualize and inspect the component and directive instances and preview or modify their state. In the next couple of sections we’ll look into how to use this tab effectively to debug your application.
Explore the application structure
In the preceding screenshot, you can see the component tree of an application.
The component tree displays a hierarchical relationship of the components and directives within your application. When you select a component or a directive instance, Angular DevTools presents additional information about that instance.
View properties
Click the individual components or directives in the component explorer to select them and preview their properties. Angular DevTools displays their properties and metadata on the right-hand side of the component tree.
Navigate in the component tree using the mouse or the following keyboard shortcuts:
Keyboard shortcut
Details
Up and down arrows
Select the previous and next nodes
Left and right arrows
Collapse and expand a node
To look up a component or directive by name use the search box above the component tree. To navigate to the next search match, press Enter. To navigate to the previous search match, press Shift + Enter.
Navigate to the host node
To go to the host element of a particular component or directive, find it in the component explorer and double-click it. Browsers’ DevTools opens the Elements tab in Chrome or the Inspector one in Firefox, and selects the associated DOM node.
Navigate to source
For components, Angular DevTools also lets you navigate to the component definition in the source tab. After you select a particular component, click the icon at the top-right of the properties view:
View injected services of components
Starting in Angular 17, services that are injected in a component or directive context are viewable in the property viewer. After you select a particular component, if that component has dependencies, you’ll be able to see them listed under the “Injected Services” bar.
By clicking on a service, an expansion panel will appear that visualizes the resolution path that Angular used to resolve that service.
Update property value
Like browsers’ DevTools, the properties view lets you edit the value of an input, output, or another property. Right-click on the property value. If edit functionality is available for this value type, you’ll see a text input. Type the new value and press Enter.
Access selected component or directive in console
As a shortcut in the console, Angular DevTools provides you access to instances of the recently selected components or directives. Type $ng0 to get a reference to the instance of the currently selected component or directive, and type $ng1 for the previously selected instance.
Select a directive or component
Similar to browsers’ DevTools, you can inspect the page to select a particular component or directive. Click the Inspect element icon in the top left corner within Angular DevTools and hover over a DOM element on the page. The extension recognizes the associated directives and/or components and lets you select the corresponding element in the Component tree.
Profile your application
The Profiler tab lets you preview the execution of Angular’s change detection.
The Profiler lets you start profiling or import an existing profile. To start profiling your application, hover over the circle in the top-left corner within the Profiler tab and click Start recording.
During profiling, Angular DevTools captures execution events, such as change detection and lifecycle hook execution. To finish recording, click the circle again to Stop recording.
You can also import an existing recording. Read more about this feature in the Import recording section.
Understand your application’s execution
In the following screenshot, find the default view of the Profiler after you complete recording.
Near the top of the view you can see a sequence of bars, each one of them symbolizing change detection cycles in your app. The taller a bar is, the longer your application has spent in this cycle. When you select a bar, DevTools renders a bar chart with all the components and directives that it captured during this cycle.
Earlier on the change detection timeline, you can find how much time Angular spent in this cycle. Angular DevTools attempts to estimate the frame drop at this point to indicate when the execution of your application might impact the user experience.
Angular DevTools also indicates what triggered the change detection (that is, the change detection’s source).
Understand component execution
When you click on a bar, you’ll find a detailed view about how much time your application spent in the particular directive or component:
Figure shows the total time spent by NgforOf directive and which method was called in it. It also shows the parent hierarchy of the directive selected.
Hierarchical views
You can also preview the change detection execution in a flame graph-like view. Each tile in the graph represents an element on the screen at a specific position in the render tree.
For example, if during one change detection cycle at a specific position in the component tree you had ComponentA, this component was removed and in its place Angular rendered ComponentB, you’ll see both components at the same tile.
Each tile is colored depending on how much time Angular spent there. DevTools determines the intensity of the color by the time spent relative to the tile where we’ve spent the most time in change detection.
When you click on a certain tile, you’ll see details about it in the panel on the right. Double-clicking the tile zooms it in so you can preview the nested children.
Debug OnPush
To preview the components in which Angular did change detection, select the Change detection checkbox at the top, above the flame graph.
This view colors all the tiles in which Angular performed change detection in green, and the rest in gray:
Import recording
Click the Save Profile button at the top-left of a recorded profiling session to export it as a JSON file and save it to the disk. Then, import the file in the initial view of the profiler by clicking the Choose file input:
Inspect your injectors
Note: The Injector Tree is available for Angular Applications built with version 17 or higher.
View the injector hierarchy of your application
The Injector Tree tab lets you explore the structure of the Injectors configured in your application. Here you will see two trees representing the injector hiearchy of your application. One tree is your environment hierarchy, the other is your element hierachy.
Visualize resolution paths
When a specific injector is selected, the path that Angular’s depenedency injection algorithm traverses from that injector to the root is highlighted. For element injectors, this includes highlighting the environment injectors that the dependency injection algorithm jumps to when a dependency cannot be resolved in the element hierarchy. See resolution rules for more details about how Angular resolves resolution paths.
View injector providers
Clicking an injector that has configured providers will display those providers in a list on the right of the injector tree view. Here you can view the provided token and it’s type.
Configuring compiler options for the Angular Language Service
To enable the latest Language Service features, set the strictTemplates option in tsconfig.json by setting strictTemplates to true, as shown in the following example:
For more information, see the Angular compiler options guide.
Features
Your editor autodetects that you are opening an Angular file. It then uses the Angular Language Service to read your tsconfig.json file, find all the templates you have in your application, and then provide language services for any templates that you open.
Language services include:
Completions lists
AOT Diagnostic messages
Quick info
Go to definition
Autocompletion
Autocompletion can speed up your development time by providing you with contextual possibilities and hints as you type. This example shows autocomplete in an interpolation. As you type it out, you can press tab to complete.
There are also completions within elements. Any elements you have as a component selector will show up in the completion list.
Error checking
The Angular Language Service can forewarn you of mistakes in your code. In this example, Angular doesn’t know what orders is or where it comes from.
Quick info and navigation
The quick-info feature lets you hover to see where components, directives, and modules come from. You can then click “Go to definition” or press F12 to go directly to the definition.
Angular Language Service in your editor
Angular Language Service is currently available as an extension for Visual Studio Code, WebStorm, Sublime Text and Eclipse IDE.
Visual Studio Code
In Visual Studio Code, install the extension from the Extensions: Marketplace. Open the marketplace from the editor using the Extensions icon on the left menu pane, or use VS Quick Open (⌘+P on Mac, CTRL+P on Windows) and type “? ext”. In the marketplace, search for Angular Language Service extension, and click the Install button.
The Visual Studio Code integration with the Angular language service is maintained and distributed by the Angular team.
Visual Studio
In Visual Studio, install the extension from the Extensions: Marketplace. Open the marketplace from the editor selecting Extensions on the top menu pane, and then selecting Manage Extensions. In the marketplace, search for Angular Language Service extension, and click the Install button.
The Visual Studio integration with the Angular language service is maintained and distributed by Microsoft with help from the Angular team. Check out the project here.
WebStorm
In WebStorm, enable the plugin Angular and AngularJS.
Since WebStorm 2019.1, the @angular/language-service is not required anymore and should be removed from your package.json.
Sublime Text
In Sublime Text, the Language Service supports only in-line templates when installed as a plug-in. You need a custom Sublime plug-in (or modifications to the current plug-in) for completions in HTML files.
To use the Language Service for in-line templates, you must first add an extension to allow TypeScript, then install the Angular Language Service plug-in. Starting with TypeScript 2.3, TypeScript has a plug-in model that the language service can use.
Install the latest version of TypeScript in a local node_modules directory:content_copynpm install --save-dev typescript
Install the Angular Language Service package in the same location:content_copynpm install --save-dev @angular/language-service
Once the package is installed, add the following to the "compilerOptions" section of your project’s tsconfig.json.tsconfig.jsoncontent_copy"plugins": [ {"name": "@angular/language-service"} ]
In your editor’s user preferences (Cmd+, or Ctrl+,), add the following:Sublime Text user preferencescontent_copy"typescript-tsdk": "<path to your folder>/node_modules/typescript/lib"
This lets the Angular Language Service provide diagnostics and completions in .ts files.
Eclipse IDE
Either directly install the “Eclipse IDE for Web and JavaScript developers” package which comes with the Angular Language Server included, or from other Eclipse IDE packages, use Help > Eclipse Marketplace to find and install Eclipse Wild Web Developer.
When you use an editor with a language service, the editor starts a separate language-service process and communicates with it through an RPC, using the Language Server Protocol. When you type into the editor, the editor sends information to the language-service process to track the state of your project.
When you trigger a completion list within a template, the editor first parses the template into an HTML abstract syntax tree (AST). The Angular compiler interprets that tree to determine the context: which module the template is part of, the current scope, the component selector, and where your cursor is in the template AST. It can then determine the symbols that could potentially be at that position.
It’s a little more involved if you are in an interpolation. If you have an interpolation of {{data.---}} inside a div and need the completion list after data.---, the compiler can’t use the HTML AST to find the answer. The HTML AST can only tell the compiler that there is some text with the characters “{{data.---}}“. That’s when the template parser produces an expression AST, which resides within the template AST. The Angular Language Services then looks at data.--- within its context, asks the TypeScript Language Service what the members of data are, and returns the list of possibilities.
A number of Angular CLI commands run a complex process on your code, such as linting, building, or testing. The commands use an internal tool called Architect to run CLI builders, which apply another tool to accomplish the wanted task.
With Angular version 8, the CLI Builder API is stable and available to developers who want to customize the Angular CLI by adding or modifying commands. For example, you could supply a builder to perform an entirely new task, or to change which third-party tool is used by an existing command.
This document explains how CLI builders integrate with the workspace configuration file, and shows how you can create your own builder.
Find the code from the examples used here in this GitHub repository.
CLI builders
The internal Architect tool delegates work to handler functions called builders. A builder handler function receives two arguments; a set of input options (a JSON object), and a context (a BuilderContext object).
The separation of concerns here is the same as with schematics, which are used for other CLI commands that touch your code (such as ng generate).
The options object is provided by the CLI user, while the context object is provided by the CLI Builder API
In addition to the contextual information, the context object, which is an instance of the BuilderContext, also provides access to a scheduling method, context.scheduleTarget(). The scheduler executes the builder handler function with a given target configuration.
The builder handler function can be synchronous (return a value) or asynchronous (return a Promise), or it can watch and return multiple values (return an Observable). The return value or values must always be of type BuilderOutput. This object contains a Boolean success field and an optional error field that can contain an error message.
Angular provides some builders that are used by the CLI for commands such as ng build and ng test. Default target configurations for these and other built-in CLI builders can be found (and customized) in the “architect” section of the workspace configuration file, angular.json. Also, extend and customize Angular by creating your own builders, which you can run using the ng run CLI command.
Builder project structure
A builder resides in a “project” folder that is similar in structure to an Angular workspace, with global configuration files at the top level, and more specific configuration in a source folder with the code files that define the behavior. For example, your myBuilder folder could contain the following files.
Files
Purpose
src/my-builder.ts
Main source file for the builder definition.
src/my-builder.spec.ts
Source file for tests.
src/schema.json
Definition of builder input options.
builders.json
Builders definition.
package.json
Dependencies. See https://docs.npmjs.com/files/package.json.
tsconfig.json
TypeScript configuration.
Publish the builder to npm (see Publishing your Library). If you publish it as @example/my-builder, install it using the following command.
content_copynpm install @example/my-builder
Creating a builder
As an example, create a builder that copies a file. To create a builder, use the createBuilder() CLI Builder function, and return a Promise<BuilderOutput> object.src/my-builder.ts (builder skeleton)
Now let’s add some logic to it. The following code retrieves the source and destination file paths from user options and copies the file from the source to the destination (using the Promise version of the built-in NodeJScopyFile()function). If the copy operation fails, it returns an error with a message about the underlying problem.src/my-builder.ts (builder)
content_copyimport { BuilderContext, BuilderOutput, createBuilder } from '@angular-devkit/architect';
import { JsonObject } from '@angular-devkit/core';
import { promises as fs } from 'fs';
interface Options extends JsonObject {
source: string;
destination: string;
}
export default createBuilder(copyFileBuilder);
async function copyFileBuilder(
options: Options,
context: BuilderContext,
): Promise<BuilderOutput> {
try {
By default, copyFile() does not print anything to the process standard output or error. If an error occurs, it might be difficult to understand exactly what the builder was trying to do when the problem occurred. Add some additional context by logging additional information using the Logger API. This also lets the builder itself be executed in a separate process, even if the standard output and error are deactivated (as in an Electron app).
You can retrieve a Logger instance from the context.src/my-builder.ts (handling output)
content_copyimport { BuilderContext, BuilderOutput, createBuilder } from '@angular-devkit/architect';
import { JsonObject } from '@angular-devkit/core';
import { promises as fs } from 'fs';
interface Options extends JsonObject {
source: string;
destination: string;
}
export default createBuilder(copyFileBuilder);
async function copyFileBuilder(
options: Options,
context: BuilderContext,
): Promise<BuilderOutput> {
try {
The CLI Builder API includes progress and status reporting tools, which can provide hints for certain functions and interfaces.
To report progress, use the context.reportProgress() method, which takes a current value, (optional) total, and status string as arguments. The total can be any number; for example, if you know how many files you have to process, the total could be the number of files, and current should be the number processed so far. The status string is unmodified unless you pass in a new string value.
You can see an example of how the tslint builder reports progress.
In our example, the copy operation either finishes or is still executing, so there’s no need for a progress report, but you can report status so that a parent builder that called our builder would know what’s going on. Use the context.reportStatus() method to generate a status string of any length.
NOTE: There’s no guarantee that a long string will be shown entirely; it could be cut to fit the UI that displays it.
Pass an empty string to remove the status.src/my-builder.ts (progress reporting)
content_copyimport { BuilderContext, BuilderOutput, createBuilder } from '@angular-devkit/architect';
import { JsonObject } from '@angular-devkit/core';
import { promises as fs } from 'fs';
interface Options extends JsonObject {
source: string;
destination: string;
}
export default createBuilder(copyFileBuilder);
async function copyFileBuilder(
options: Options,
context: BuilderContext,
): Promise<BuilderOutput> {
context.reportStatus(Copying ${options.source} to ${options.destination}.);
try {
You can invoke a builder indirectly through a CLI command, or directly with the Angular CLI ng run command. In either case, you must provide required inputs, but can let other inputs default to values that are pre-configured for a specific target, provide a pre-defined, named override configuration, and provide further override option values on the command line.
Input validation
You define builder inputs in a JSON schema associated with that builder. The Architect tool collects the resolved input values into an options object, and validates their types against the schema before passing them to the builder function. (The Schematics library does the same kind of validation of user input.)
For our example builder, you expect the options value to be a JsonObject with two keys: A source and a destination, each of which are a string.
You can provide the following schema for type validation of these values.src/schema.json
The official name of our builder is now @example/copy-file:copy. The first part of this is the package name (resolved using node resolution), and the second part is the builder name (resolved using the builders.json file).
Using one of our options is very straightforward. You did this in the previous section when you accessed options.source and options.destination.src/my-builder.ts (report status)
content_copycontext.reportStatus(Copying ${options.source} to ${options.destination}.);
try {
await fs.copyFile(options.source, options.destination);
} catch (err) {
context.logger.error('Failed to copy file.');
return {
A builder must have a defined target that associates it with a specific input configuration and project.
Targets are defined in the angular.json CLI configuration file. A target specifies the builder to use, its default options configuration, and named alternative configurations. The Architect tool uses the target definition to resolve input options for a given run.
The angular.json file has a section for each project, and the “architect” section of each project configures targets for builders used by CLI commands such as ‘build’, ‘test’, and ‘lint’. By default, for example, the build command runs the builder @angular-devkit/build-angular:browser to perform the build task, and passes in default option values as specified for the build target in angular.json.angular.json
The command passes the builder the set of default options specified in the "options" section. If you pass the --configuration=production flag, it uses the override values specified in the production alternative configuration. Specify further option overrides individually on the command line. You might also add more alternative configurations to the build target, to define other environments such as stage or qa.
Target strings
The generic ng run CLI command takes as its first argument a target string of the following form.
content_copyproject:target[:configuration]
Details
project
The name of the Angular CLI project that the target is associated with.
target
A named builder configuration from the architect section of the angular.json file.
configuration
(optional) The name of a specific configuration override for the given target, as defined in the angular.json file.
If your builder calls another builder, it might need to read a passed target string. Parse this string into an object by using the targetFromTargetString() utility function from @angular-devkit/architect.
Schedule and run
Architect runs builders asynchronously. To invoke a builder, you schedule a task to be run when all configuration resolution is complete.
The builder function is not executed until the scheduler returns a BuilderRun control object. The CLI typically schedules tasks by calling the context.scheduleTarget() function, and then resolves input options using the target definition in the angular.json file.
Architect resolves input options for a given target by taking the default options object, then overwriting values from the configuration used (if any), then further overwriting values from the overrides object passed to context.scheduleTarget(). For the Angular CLI, the overrides object is built from command line arguments.
Architect validates the resulting options values against the schema of the builder. If inputs are valid, Architect creates the context and executes the builder.
For more information see Workspace Configuration.
You can also invoke a builder directly from another builder or test by calling context.scheduleBuilder(). You pass an options object directly to the method, and those option values are validated against the schema of the builder without further adjustment.
Only the context.scheduleTarget() method resolves the configuration and overrides through the angular.json file.
Default architect configuration
Let's create a simple angular.json file that puts target configurations into context.
You can publish the builder to npm (see Publishing your Library), and install it using the following command:
content_copynpm install @example/copy-file
If you create a new project with ng new builder-test, the generated angular.json file looks something like this, with only default builder configurations.angular.json
Add a new target that will run our builder to copy a file. This target tells the builder to copy the package.json file.
You need to update the angular.json file to add a target for this builder to the "architect" section of our new project.
We'll add a new target section to the "architect" object for our project
The target named "copy-package" uses our builder, which you published to @example/copy-file. (See Publishing your Library.)
The options object provides default values for the two inputs that you defined; source, which is the existing file you are copying, and destination, the path you want to copy to
The configurations key is optional, we'll leave it out for now
To run our builder with the new target's default configuration, use the following CLI command.
content_copyng run builder-test:copy-package
This copies the package.json file to package-copy.json.
Use command-line arguments to override the configured defaults. For example, to run with a different destination value, use the following CLI command.
content_copyng run builder-test:copy-package --destination=package-other.json
This copies the file to package-other.json instead of package-copy.json. Because you did not override the source option, it will copy from the package.json file (the default value provided for the target).
Testing a builder
Use integration testing for your builder, so that you can use the Architect scheduler to create a context, as in this example.
In the builder source directory, you have created a new test file my-builder.spec.ts. The code creates new instances of JsonSchemaRegistry (for schema validation), TestingArchitectHost (an in-memory implementation of ArchitectHost), and Architect.
We've added a builders.json file next to the builder's package.json file, and modified the package file to point to it.
Here's an example of a test that runs the copy file builder. The test uses the builder to copy the package.json file and validates that the copied file's contents are the same as the source.src/my-builder.spec.ts
content_copyimport { Architect } from '@angular-devkit/architect';
import { TestingArchitectHost } from '@angular-devkit/architect/testing';
import { schema } from '@angular-devkit/core';
import { promises as fs } from 'fs';
import { join } from 'path';
describe('Copy File Builder', () => {
let architect: Architect;
let architectHost: TestingArchitectHost;
beforeEach(async () => {
const registry = new schema.CoreSchemaRegistry();
registry.addPostTransform(schema.transforms.addUndefinedDefaults);
// TestingArchitectHost() takes workspace and current directories.
// Since we don't use those, both are the same in this case.
architectHost = new TestingArchitectHost(__dirname, __dirname);
architect = new Architect(architectHost, registry);
// This will either take a Node package name, or a path to the directory
// for the package.json file.
await architectHost.addBuilderFromPackage(join(__dirname, '..'));
});
it('can copy files', async () => {
// A "run" can have multiple outputs, and contains progress information.
const run = await architect.scheduleBuilder('@example/copy-file:copy', {
source: 'package.json',
destination: 'package-copy.json',
});
// The "result" member (of type BuilderOutput) is the next output.
const output = await run.result;
// Stop the builder from running. This stops Architect from keeping
// the builder-associated states in memory, since builders keep waiting
// to be scheduled.
await run.stop();
// Expect that the copied file is the same as its source.
const sourceContent = await fs.readFile('package.json', 'utf8');
const destinationContent = await fs.readFile('package-copy.json', 'utf8');
expect(destinationContent).toBe(sourceContent);
});
});
When running this test in your repo, you need the ts-node package. You can avoid this by renaming my-builder.spec.ts to my-builder.spec.js.
Watch mode
Architect expects builders to run once (by default) and return. This behavior is not entirely compatible with a builder that watches for changes (like Webpack, for example). Architect can support watch mode, but there are some things to look out for.
To be used with watch mode, a builder handler function should return an Observable. Architect subscribes to the Observable until it completes and might reuse it if the builder is scheduled again with the same arguments.
The builder should always emit a BuilderOutput object after each execution. Once it's been executed, it can enter a watch mode, to be triggered by an external event. If an event triggers it to restart, the builder should execute the context.reportRunning() function to tell Architect that it is running again. This prevents Architect from stopping the builder if another run is scheduled.
When your builder calls BuilderRun.stop() to exit watch mode, Architect unsubscribes from the builder's Observable and calls the builder's teardown logic to clean up. (This behavior also allows for long-running builds to be stopped and cleaned up.)
In general, if your builder is watching an external event, you should separate your run into three phases.
Phases
Details
Running
For example, webpack compiles. This ends when webpack finishes and your builder emits a BuilderOutput object.
Watching
Between two runs, watch an external event stream. For example, webpack watches the file system for any changes. This ends when webpack restarts building, and context.reportRunning() is called. This goes back to step 1.
Completion
Either the task is fully completed (for example, webpack was supposed to run a number of times), or the builder run was stopped (using BuilderRun.stop()). Your teardown logic is executed, and Architect unsubscribes from your builder's Observable.
In this chapter, we will understand the various aspects of neural network training which can be implemented using TensorFlow framework.
Following are the ten recommendations, which can be evaluated −
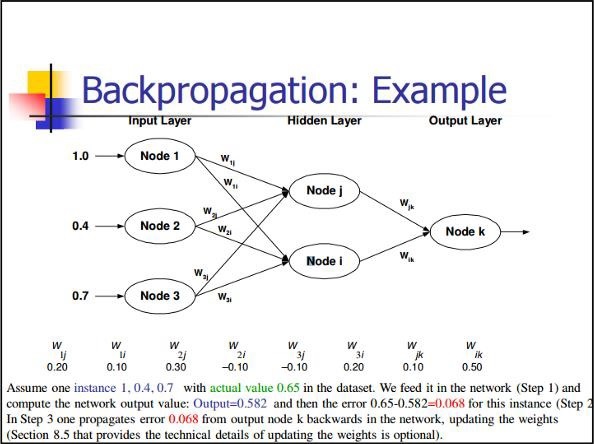
Back Propagation
Back propagation is a simple method to compute partial derivatives, which includes the basic form of composition best suitable for neural nets.
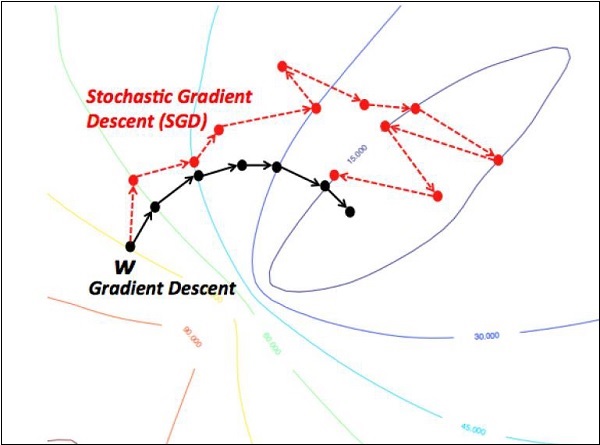
Stochastic Gradient Descent
In stochastic gradient descent, a batch is the total number of examples, which a user uses to calculate the gradient in a single iteration. So far, it is assumed that the batch has been the entire data set. The best illustration is working at Google scale; data sets often contain billions or even hundreds of billions of examples.
Explore our latest online courses and learn new skills at your own pace. Enroll and become a certified expert to boost your career.
Learning Rate Decay
Adapting the learning rate is one of the most important features of gradient descent optimization. This is crucial to TensorFlow implementation.
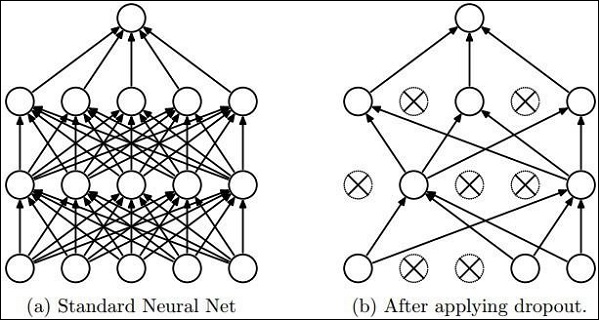
Dropout
Deep neural nets with a large number of parameters form powerful machine learning systems. However, over fitting is a serious problem in such networks.
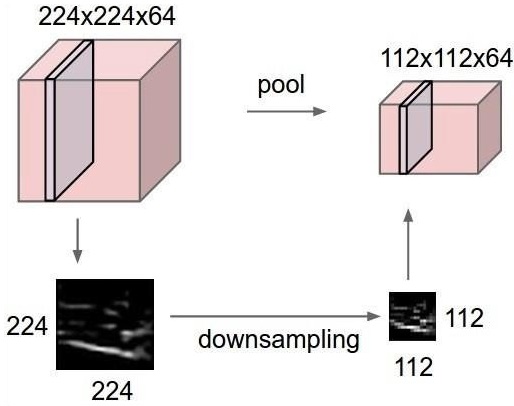
Max Pooling
Max pooling is a sample-based discretization process. The object is to down-sample an input representation, which reduces the dimensionality with the required assumptions.
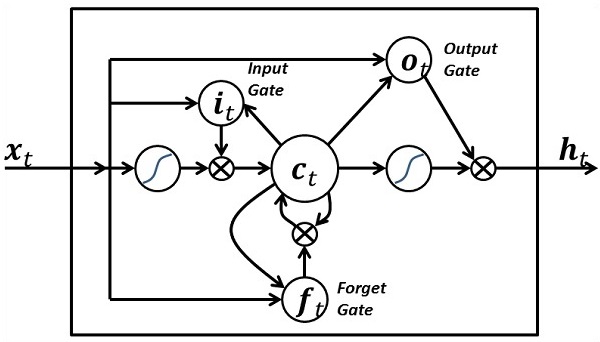
Long Short Term Memory (LSTM)
LSTM controls the decision on what inputs should be taken within the specified neuron. It includes the control on deciding what should be computed and what output should be generated.
You can define different named build configurations for your project, such as development and staging, with different defaults.
Each named configuration can have defaults for any of the options that apply to the various builder targets, such as build, serve, and test. The Angular CLI build, serve, and test commands can then replace files with appropriate versions for your intended target environment.
Configure environment-specific defaults
Using the Angular CLI, start by running the generate environments command shown here to create the src/environments/ directory and configure the project to use these files.
content_copyng generate environments
The project’s src/environments/ directory contains the base configuration file, environment.ts, which provides configuration for production, the default environment. You can override default values for additional environments, such as development and staging, in target-specific configuration files.
For example:
myProject/src/environments
environment.ts
environment.development.ts
environment.staging.ts
The base file environment.ts, contains the default environment settings. For example:
The build command uses this as the build target when no environment is specified. You can add further variables, either as additional properties on the environment object, or as separate objects. For example, the following adds a default for a variable to the default environment:
You can add target-specific configuration files, such as environment.development.ts. The following content sets default values for the development build target:
The following application structure configures build targets for development and staging environments:
src
app
app.component.html
app.component.ts
environments
environment.ts
environment.development.ts
environment.staging.ts
To use the environment configurations you have defined, your components must import the original environments file:
content_copyimport { environment } from './../environments/environment';
This ensures that the build and serve commands can find the configurations for specific build targets.
The following code in the component file (app.component.ts) uses an environment variable defined in the configuration files.
content_copyimport { Component } from '@angular/core';
import { environment } from './../environments/environment';

@Component({
  selector: 'app-root',
  templateUrl: './app.component.html',
  styleUrls: ['./app.component.css']
})
export class AppComponent {
  constructor() {
console.log(environment.production); // Logs false for development environment  }

  title = 'app works!';
}
Configure target-specific file replacements
The main CLI configuration file, angular.json, contains a fileReplacements section in the configuration for each build target, which lets you replace any file in the TypeScript program with a target-specific version of that file. This is useful for including target-specific code or variables in a build that targets a specific environment, such as production or staging.
By default no files are replaced. You can add file replacements for specific build targets. For example:
This means that when you build your development configuration with ng build --configuration development, the src/environments/environment.ts file is replaced with the target-specific version of the file, src/environments/environment.development.ts.
You can add additional configurations as required. To add a staging environment, create a copy of src/environments/environment.ts called src/environments/environment.staging.ts, then add a staging configuration to angular.json:
You can add more configuration options to this target environment as well. Any option that your build supports can be overridden in a build target configuration.
To build using the staging configuration, run the following command:
content_copyng build --configuration=staging
You can also configure the serve command to use the targeted build configuration if you add it to the "serve:configurations" section of angular.json:
As applications grow in functionality, they also grow in size. The CLI lets you set size thresholds in your configuration to ensure that parts of your application stay within size boundaries that you define.
Define your size boundaries in the CLI configuration file, angular.json, in a budgets section for each configured environment.
content_copy{
…
"configurations": {
"production": {
…
"budgets": []
}
}
}
You can specify size budgets for the entire app, and for particular parts. Each budget entry configures a budget of a given type. Specify size values in the following formats:
Size value
Details
123 or 123b
Size in bytes.
123kb
Size in kilobytes.
123mb
Size in megabytes.
12%
Percentage of size relative to baseline. (Not valid for baseline values.)
When you configure a budget, the build system warns or reports an error when a given part of the application reaches or exceeds a boundary size that you set.
Each budget entry is a JSON object with the following properties:
Property
Value
type
The type of budget. One of:ValueDetailsbundleThe size of a specific bundle.initialThe size of JavaScript needed for bootstrapping the application. Defaults to warning at 500kb and erroring at 1mb.allScriptThe size of all scripts.allThe size of the entire application.anyComponentStyleThis size of any one component stylesheet. Defaults to warning at 2kb and erroring at 4kb.anyScriptThe size of any one script.anyThe size of any file.
name
The name of the bundle (for type=bundle).
baseline
The baseline size for comparison.
maximumWarning
The maximum threshold for warning relative to the baseline.
maximumError
The maximum threshold for error relative to the baseline.
minimumWarning
The minimum threshold for warning relative to the baseline.
minimumError
The minimum threshold for error relative to the baseline.
warning
The threshold for warning relative to the baseline (min & max).
error
The threshold for error relative to the baseline (min & max).
Configuring CommonJS dependencies
It is recommended that you avoid depending on CommonJS modules in your Angular applications. Depending on CommonJS modules can prevent bundlers and minifiers from optimizing your application, which results in larger bundle sizes. Instead, it is recommended that you use ECMAScript modules in your entire application. For more information, see How CommonJS is making your bundles larger.
The Angular CLI outputs warnings if it detects that your browser application depends on CommonJS modules. To disable these warnings, add the CommonJS module name to allowedCommonJsDependencies option in the build options located in angular.json file.
The Angular CLI uses Browserslist to ensure compatibility with different browser versions. Autoprefixer is used for CSS vendor prefixing and @babel/preset-env for JavaScript syntax transformations.
Internally, the Angular CLI uses the below browserslist configuration which matches the browsers that are supported by Angular.
content_copylast 2 Chrome versions
last 1 Firefox version
last 2 Edge major versions
last 2 Safari major versions
last 2 iOS major versions
Firefox ESR
To override the internal configuration, run ng generate config browserslist, which generates a .browserslistrc configuration file in the project directory.
See the browserslist repository for more examples of how to target specific browsers and versions.
Use browsersl.ist to display compatible browsers for a browserslist query.
Proxying to a backend server
Use the proxying support in the webpack development server to divert certain URLs to a backend server, by passing a file to the --proxy-config build option. For example, to divert all calls for http://localhost:4200/api to a server running on http://localhost:3000/api, take the following steps.
Create a file proxy.conf.json in your project's src/ folder.
Add the following content to the new proxy file:content_copy{ "/api": { "target": "http://localhost:3000", "secure": false } }
In the CLI configuration file, angular.json, add the proxyConfig option to the serve target:content_copy… "architect": { "serve": { "builder": "@angular-devkit/build-angular:dev-server", "options": { "browserTarget": "your-application-name:build", "proxyConfig": "src/proxy.conf.json" }, …
To run the development server with this proxy configuration, call ng serve.
Edit the proxy configuration file to add configuration options; following are some examples. For a description of all options, see webpack DevServer documentation.
NOTE: If you edit the proxy configuration file, you must relaunch the ng serve process to make your changes effective.
As of Node version 17, Node will not always resolve http://localhost:<port> to http://127.0.0.1:<port> depending on each machine's configuration.
If you get an ECONNREFUSED error using a proxy targeting a localhost URL, you can fix this issue by updating the target from http://localhost:<port> to http://127.0.0.1:<port>.
See the http proxy middleware documentation for more information.
Rewrite the URL path
The pathRewrite proxy configuration option lets you rewrite the URL path at run time. For example, specify the following pathRewrite value to the proxy configuration to remove "api" from the end of a path.
If you need to optionally bypass the proxy, or dynamically change the request before it's sent, add the bypass option, as shown in this JavaScript example.
content_copyexport default {
'/api/proxy': {
"target": 'http://localhost:3000',
"secure": false,
"bypass": function (req, res, proxyOptions) {
if (req.headers.accept.includes('html')) {
console.log('Skipping proxy for browser request.');
return '/index.html';
}
req.headers['X-Custom-Header'] = 'yes';
}
}
};
Using corporate proxy
If you work behind a corporate proxy, the backend cannot directly proxy calls to any URL outside your local network. In this case, you can configure the backend proxy to redirect calls through your corporate proxy using an agent:
When you define an environment variable http_proxy or HTTP_PROXY, an agent is automatically added to pass calls through your corporate proxy when running npm start.
Use the following content in the JavaScript configuration file.
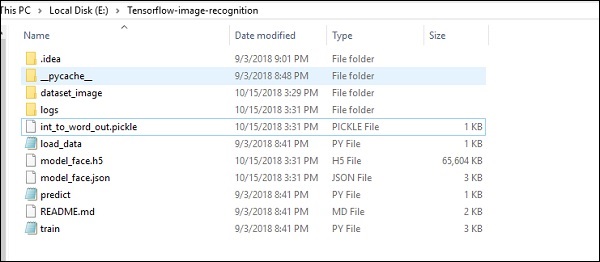
TensorFlow includes a special feature of image recognition and these images are stored in a specific folder. With relatively same images, it will be easy to implement this logic for security purposes.
The folder structure of image recognition code implementation is as shown below −
The dataset_image includes the related images, which need to be loaded. We will focus on image recognition with our logo defined in it. The images are loaded with “load_data.py” script, which helps in keeping a note on various image recognition modules within them.
import pickle
from sklearn.model_selection import train_test_split
from scipy import misc
import numpy as np
import os
label = os.listdir("dataset_image")
label = label[1:]
dataset = []
for image_label in label:
images = os.listdir("dataset_image/"+image_label)
for image in images:
X = []
Y = []
for input,image_label in dataset:
X.append(input)
Y.append(label.index(image_label))
X = np.array(X)
Y = np.array(Y)
X_train,y_train, = X,Y
data_set = (X_train,y_train)
save_label = open("int_to_word_out.pickle","wb")
pickle.dump(label, save_label)
save_label.close()
The training of images helps in storing the recognizable patterns within specified folder.
import numpy
import matplotlib.pyplot as plt
from keras.layers import Dropout
from keras.layers import Flatten
from keras.constraints import maxnorm
from keras.optimizers import SGD
from keras.layers import Conv2D
from keras.layers.convolutional import MaxPooling2D
from keras.utils import np_utils
from keras import backend as K
import load_data
from keras.models import Sequential
from keras.layers import Dense
import keras
K.set_image_dim_ordering('tf')
# fix random seed for reproducibility
seed = 7
numpy.random.seed(seed)
# load data
(X_train,y_train) = load_data.data_set
# normalize inputs from 0-255 to 0.0-1.0
X_train = X_train.astype('float32')
#X_test = X_test.astype('float32')
X_train = X_train / 255.0
#X_test = X_test / 255.0
# one hot encode outputs
y_train = np_utils.to_categorical(y_train)
#y_test = np_utils.to_categorical(y_test)
num_classes = y_train.shape[1]
# Create the model
model = Sequential()
model.add(Conv2D(32, (3, 3), input_shape = (64, 64, 3), padding = 'same',
activation = 'relu', kernel_constraint = maxnorm(3)))
model.add(Dropout(0.2))
model.add(Conv2D(32, (3, 3), activation = 'relu', padding = 'same',
kernel_constraint = maxnorm(3)))
model.add(MaxPooling2D(pool_size = (2, 2)))
model.add(Flatten())
model.add(Dense(512, activation = 'relu', kernel_constraint = maxnorm(3)))
model.add(Dropout(0.5))
model.add(Dense(num_classes, activation = 'softmax'))
# Compile model
epochs = 10
lrate = 0.01
decay = lrate/epochs
sgd = SGD(lr = lrate, momentum = 0.9, decay = decay, nesterov = False)
model.compile(loss = 'categorical_crossentropy', optimizer = sgd, metrics = ['accuracy'])
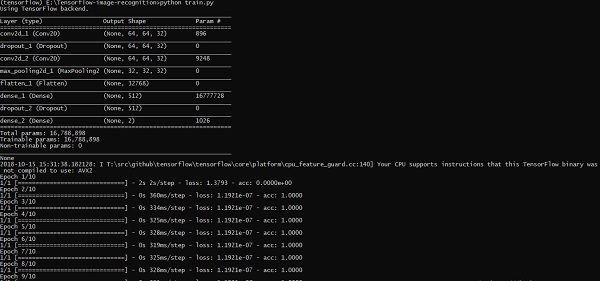
print(model.summary())
#callbacks = [keras.callbacks.EarlyStopping(
monitor = 'val_loss', min_delta = 0, patience = 0, verbose = 0, mode = 'auto')]
callbacks = [keras.callbacks.TensorBoard(log_dir='./logs',
histogram_freq = 0, batch_size = 32, write_graph = True, write_grads = False,
write_images = True, embeddings_freq = 0, embeddings_layer_names = None,
embeddings_metadata = None)]
# Fit the model
model.fit(X_train, y_train, epochs = epochs,
batch_size = 32,shuffle = True,callbacks = callbacks)
# Final evaluation of the model
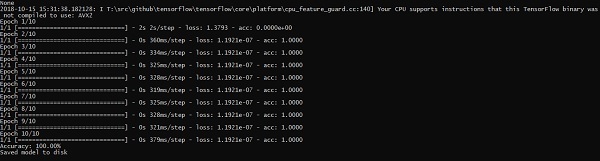
scores = model.evaluate(X_train, y_train, verbose = 0)
print("Accuracy: %.2f%%" % (scores[1]*100))
# serialize model to JSONx
model_json = model.to_json()
with open("model_face.json", "w") as json_file:
json_file.write(model_json)
# serialize weights to HDF5
model.save_weights("model_face.h5")
print("Saved model to disk")
The above line of code generates an output as shown below −
A partial differential equation (PDE) is a differential equation, which involves partial derivatives with unknown function of several independent variables. With reference to partial differential equations, we will focus on creating new graphs.
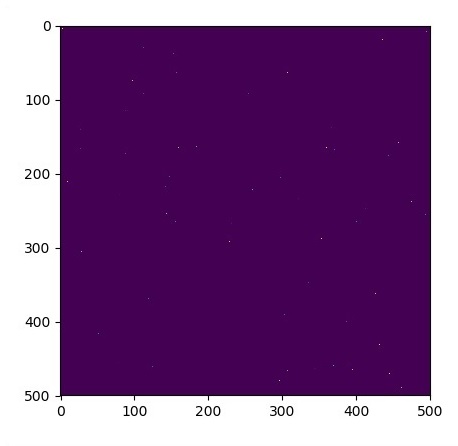
Let us assume there is a pond with dimension 500*500 square −
N = 500
Now, we will compute partial differential equation and form the respective graph using it. Consider the steps given below for computing graph.
Step 1 − Import libraries for simulation.
import tensorflow as tf
import numpy as np
import matplotlib.pyplot as plt
Step 2 − Include functions for transformation of a 2D array into a convolution kernel and simplified 2D convolution operation.
def make_kernel(a):
   a = np.asarray(a)
   a = a.reshape(list(a.shape) + [1,1])
   return tf.constant(a, dtype=1)

def simple_conv(x, k):
   """A simplified 2D convolution operation"""
   x = tf.expand_dims(tf.expand_dims(x, 0), -1)
   y = tf.nn.depthwise_conv2d(x, k, [1, 1, 1, 1], padding = 'SAME')
   return y[0, :, :, 0]

def laplace(x):
   """Compute the 2D laplacian of an array"""
   laplace_k = make_kernel([[0.5, 1.0, 0.5], [1.0, -6., 1.0], [0.5, 1.0, 0.5]])
   return simple_conv(x, laplace_k)

sess = tf.InteractiveSession()
Step 3 − Include the number of iterations and compute the graph to display the records accordingly.
N = 500
# Initial Conditions -- some rain drops hit a pond
# Set everything to zero
u_init = np.zeros([N, N], dtype = np.float32)
ut_init = np.zeros([N, N], dtype = np.float32)
# Some rain drops hit a pond at random points
for n in range(100):
a,b = np.random.randint(0, N, 2)
u_init[a,b] = np.random.uniform()
plt.imshow(u_init)
plt.show()
# Parameters:
# eps -- time resolution
# damping -- wave damping
eps = tf.placeholder(tf.float32, shape = ())
damping = tf.placeholder(tf.float32, shape = ())
# Create variables for simulation state
U = tf.Variable(u_init)
Ut = tf.Variable(ut_init)
# Discretized PDE update rules
U_ = U + eps * Ut
Ut_ = Ut + eps * (laplace(U) - damping * Ut)
# Operation to update the state
step = tf.group(U.assign(U_), Ut.assign(Ut_))
# Initialize state to initial conditions
tf.initialize_all_variables().run()
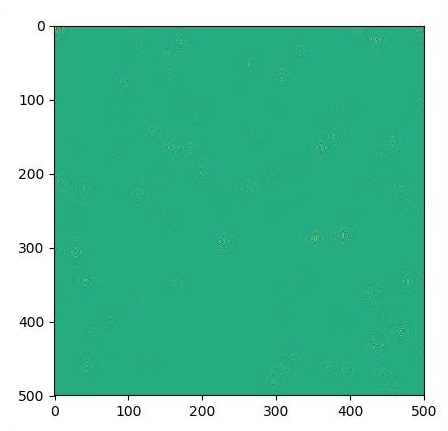
# Run 1000 steps of PDE
for i in range(1000):
# Step simulation
step.run({eps: 0.03, damping: 0.04})
# Visualize every 50 steps
if i % 500 == 0:
In this chapter, we will learn about the XOR implementation using TensorFlow. Before starting with XOR implementation in TensorFlow, let us see the XOR table values. This will help us understand encryption and decryption process.
A
B
A XOR B
0
0
0
0
1
1
1
0
1
1
1
0
XOR Cipher encryption method is basically used to encrypt data which is hard to crack with brute force method, i.e., by generating random encryption keys which match the appropriate key.
The concept of implementation with XOR Cipher is to define a XOR encryption key and then perform XOR operation of the characters in the specified string with this key, which a user tries to encrypt. Now we will focus on XOR implementation using TensorFlow, which is mentioned below −
#Declaring necessary modules
import tensorflow as tf
import numpy as np
"""
A simple numpy implementation of a XOR gate to understand the backpropagation
algorithm
"""
x = tf.placeholder(tf.float64,shape = [4,2],name = "x")
#declaring a place holder for input x
y = tf.placeholder(tf.float64,shape = [4,1],name = "y")
#declaring a place holder for desired output y
m = np.shape(x)[0]#number of training examples
n = np.shape(x)[1]#number of features
hidden_s = 2 #number of nodes in the hidden layer
l_r = 1#learning rate initialization
theta1 = tf.cast(tf.Variable(tf.random_normal([3,hidden_s]),name = "theta1"),tf.float64)
theta2 = tf.cast(tf.Variable(tf.random_normal([hidden_s+1,1]),name = "theta2"),tf.float64)
#conducting forward propagation
a1 = tf.concat([np.c_[np.ones(x.shape[0])],x],1)
#the weights of the first layer are multiplied by the input of the first layer
z1 = tf.matmul(a1,theta1)
#the input of the second layer is the output of the first layer, passed through the
activation function and column of biases is added
a2 = tf.concat([np.c_[np.ones(x.shape[0])],tf.sigmoid(z1)],1)
#the input of the second layer is multiplied by the weights
z3 = tf.matmul(a2,theta2)
#the output is passed through the activation function to obtain the final probability
h3 = tf.sigmoid(z3)
cost_func = -tf.reduce_sum(y*tf.log(h3)+(1-y)*tf.log(1-h3),axis = 1)
#built in tensorflow optimizer that conducts gradient descent using specified
learning rate to obtain theta values
optimiser = tf.train.GradientDescentOptimizer(learning_rate = l_r).minimize(cost_func)
#setting required X and Y values to perform XOR operation
X = [[0,0],[0,1],[1,0],[1,1]]
Y = [[0],[1],[1],[0]]
#initializing all variables, creating a session and running a tensorflow session
init = tf.global_variables_initializer()
sess = tf.Session()
sess.run(init)
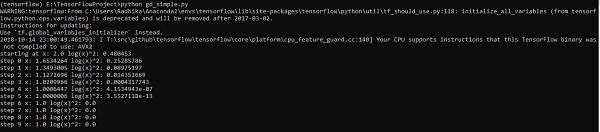
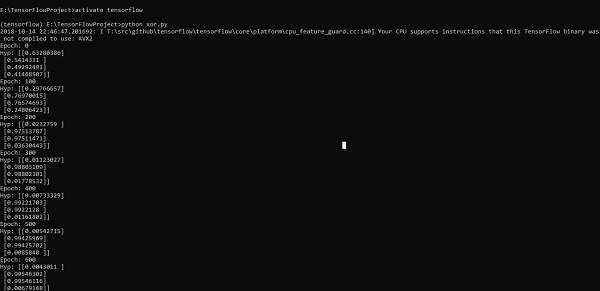
#running gradient descent for each iteration and printing the hypothesis
obtained using the updated theta values
for i in range(100000):
sess.run(optimiser, feed_dict = {x:X,y:Y})#setting place holder values using feed_dict
if i%100==0:
Optimizers are the extended class, which include added information to train a specific model. The optimizer class is initialized with given parameters but it is important to remember that no Tensor is needed. The optimizers are used for improving speed and performance for training a specific model.
The basic optimizer of TensorFlow is −
tf.train.Optimizer
This class is defined in the specified path of tensorflow/python/training/optimizer.py.
Following are some optimizers in Tensorflow −
Stochastic Gradient descent
Stochastic Gradient descent with gradient clipping
Momentum
Nesterov momentum
Adagrad
Adadelta
RMSProp
Adam
Adamax
SMORMS3
We will focus on the Stochastic Gradient descent. The illustration for creating optimizer for the same is mentioned below −
def sgd(cost, params, lr = np.float32(0.01)):
   g_params = tf.gradients(cost, params)
   updates = []

   for param, g_param in zip(params, g_params):
  updates.append(param.assign(param - lr*g_param))   return updates
The basic parameters are defined within the specific function. In our subsequent chapter, we will focus on Gradient Descent Optimization with implementation of optimizers.