Scalable Vector Graphics, in short SVG, is used to create vector-based graphics in XML format. XML is a markup language like HTML that stores and transfers data on the web.
SVG provides a framework for creating rich graphics with declarative programming. Angular template can be applied to the SVG to create dynamic graphics with minimal effort.
In this chapter, we will understand how to create SVG as an Angular Template.
Creating SVG as a Template
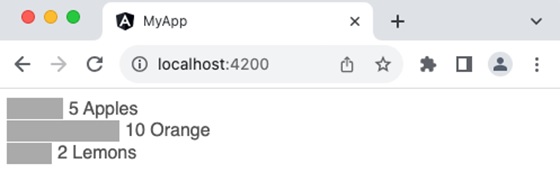
Let us create a simple bar chart in SVG format and use it in our template and then update the bar chart dynamically through template input variables.
Step 1: Create a new application using angular CLI as shown below −
$ ng newmy-app
Step 2: Create a component, chart using angular CLI as shown below −
ngFor (structural directive) is used to loop over the fruits.
Attribute binding ([attr.width], [attr.x] & [attr-y]) is used along with template statement to dynamically add each bar in the chart based on the fruits template variable
fruit.count * 10 is a template statement, which sets the width of the bar based on the fruit count
0 + (i * 20) is another template statement, which sets the y position of the bar in the chart.
fruit.count * 10 + 5 is another template statement, which sets x position of the text at the end of the bar in the chart.
10 + (i * 20) is another template statement, which sets the y position of the text at the end of the bar in the chart.
Step 13: Run the application and check whether the chart is rendered properly.

Leave a Reply